

Platforms existed before Chris Anderson’s 2006 book The Long Tail, but no other single work did more to bring the concept of exploiting micro-markets to the mass consciousness. The core idea is simple: Although blockbusters and bestsellers get all the attention and show disproportionate sales volume on a per unit basis, items that sell fewer units individually can present a large opportunity cumulatively. The top selling items represent the “fat head” and the lesser selling items make up the “long tail.” Internet-enabled platforms allow entrepreneurs to find so-called long tail opportunities in a cost-effective manner – difficult or impossible in the days before technology made them accessible. But the real winners have been the platforms themselves: Amazon, Google, and Facebook have made billions on the long tail idea, providing the infrastructure to aggregate these small opportunities. It should come as no surprise that the real interest from the investment community isn’t in the fat head nor in the long tail, but rather in the platform itself.
Entrepreneurs and investors may want to rethink the wisdom of platform strategies in light of new evidence of the true risks. However, if they’re willing to jump in the pool, it makes sense to know how deep it is.
Introduction
Neither the “long tail” nor the “fat tail” are new ideas. Both ideas come from statistics – specifically, they are easy words laypeople (non-mathematicians) can use to visualize a statistical distribution. Let’s do that.
Imagine a bell curve – the “normal” distribution you learned about in high school – and notice how the curve stretches off to either direction, getting skinnier as it goes. In practical terms, that means the further out you go, the less likely a result will be. That’s why you don’t see many people greater than 8-feet tall. We tend to see distributions like this one in the natural world, most often in biology, chemistry, and physics. In fact, that’s probably where you learned about it.
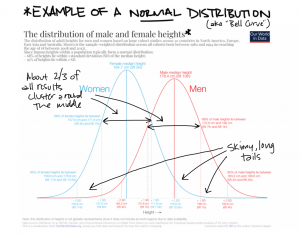
Our World in Data is a treasure trove of fun visualizations like this one.
Now imagine that same bell curve, but then pull it up it a little at each end and stretch it at the top. In simple terms, this means that events closer to the center and farther away from the center are more likely than in a normal distribution. It’s the middle that’s skinny. (Look up Pareto and log-normal distributions if you want to geek out.) We see this sort of pattern in certain natural phenomenon (earthquakes, for example), but especially in financial markets. On one side of the graph, you can get very unlikely positive events – a startup skyrocketing in value just after you bought it. On the other side of the graph, you can get the 2008 financial crisis. The implications are very simple, but profound: Although the likelihood of either event happening at any one specific time is vanishingly small, the likelihood that event will happen eventually is (essentially) 100%.
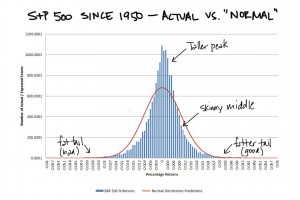
Standard & Poor’s (of S&P500 fame) provides this data of monthly returns over the past 70 years or so. Notice how the “normal” distribution doesn’t match up well to actual events.
You can read all about this sort of thing in Taleb’s The Black Swan, so I won’t belabor the point. What’s important to understand is that we don’t just see fat tails in financial markets. We see them in marketing. All the time. You simply may not recognize them because they look a little different.
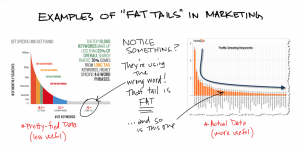
Misinterpretation of mathematics is, perhaps, marketing’s greatest “gift” to the world. Oh, and one more thing: Whenever a marketing person offers you a multi-colored, smooth chart representing data, be suspicious. It’s probably bullshit.
What we see here is simply one-half of the distribution we saw previously, because in marketing, it doesn’t make sense to have “negative” sales of something. (Or does it? More on that in a minute.) To get specific, we see fat tailed distributions in the following common situations:
- Popularity of search terms on Google
- Sales of individual products on Amazon
- Frequency of posts from certain individuals on Facebook or Twitter
If you’ve ever plotted “sales by customer” for your business, you’ve likely seen the same sort of chart. It’s not a normal distribution; it’s usually a Pareto distribution. They resulting chart features a fat tail, not a long tail.
This may seem like a nit, but language we use to describe our world is critical to how we choose to act on it. Chris Anderson wanted to make a distinction between the “fat head” and the “long tail” – because that’s what it looks like, right? Could you see a book titled “The Fat Tail” selling quite so well? Anderson’s publishers were smart not to be accurate. Long tends to be a positive word. Fat tends to be a negative word.
However, that lack of accuracy hides a nasty surprise: Anderson’s “long tail” isn’t a long tail at all. It’s a fat tail. That’s why there is so much opportunity for aggregation of niche demand. A statistical long tail wouldn’t be as interesting, nor would it be as profitable. To paraphrase the central point: With great opportunity comes great risk. Platforms that exploit these fat tails underestimate systemic risk. They have exploded in value because they take advantage of the upside. They will implode, eventually, because of the inherent downside – a downside they are ignoring.
Why is that? We could argue that our language (long tail instead of fat tail) and our visualization (only showing the positive side of the curve) hide that risk. But more than that, most entrepreneurs aren’t thinking of the downside when they craft a platform strategy because they haven’t seen a major meltdown in a platform company. Even those who understand (and accept) fat tail risks point out that legislation protects platforms from liability, mooting those risks. In a risk-free environment, why not take advantage?
Reasonable. Stupid, but seemingly reasonable.
Laws can change. When they do, every platform is exposed. And if you don’t have the financial and legal resources to protect yourself, your platform implodes. We’ll use the example of a medical device connectivity platform (cloud-based infrastructure that connects pacemakers, heart monitors, and other medical equipment, and stores/synthesizes their data), to help us illustrate the problem, as well possible solutions.
Stop misinterpreting negative results as a cost of doing business. Start visualizing both sides of the distribution of possible events.
What can these geeky statistical artifacts tell us about risk in a platform strategy? We’ve already seen how marketing has fumbled the distinction between a “fat tail” and a “long tail,” but what does it really matter? All sales are positive events, aren’t they?
Perhaps not.
When we see all sales (or all content, or all search results, or all data collection) as positive, it means we only visualize one half of the graph – the right-skewed side distribution, always trailing off in the positive direction. The tail might be “fat,” but a fatter tail only means that there is more hidden opportunity than a “long tail” would predict. That’s why Google, Facebook, and Amazon make so much money.
Isn’t it funny, however, that the previous graphs (from biology and finance, respectively) showed full curves with both a right and a left distribution? Hmm. What would happen if we graphed that in a marketing context? Let’s try.
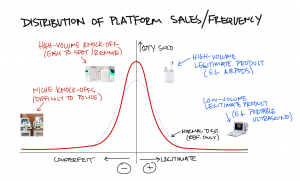
This graph is a thought experiment, showing sales of legitimate products as “positive” events and the sales of counterfeit products as “negative” events on an ecommerce platform such as Amazon or Alibaba.
Consider the implications of this visual thought experiment. We plot legitimate products and sales on the right side of the graph, and counterfeit (illegitimate) product sales on the left side of the graph. All sales are “positive” in revenue terms, but the impacts are not. A counterfeit sale could be graphed as the equivalent of a reduction in sales of the legitimate product. (If you like, think of this as the “Upside Down” of normal commerce.)
Near the tall head of the (now mirrored) graph, we find counterfeit versions of high-value products – knockoffs of popular movies, electronics, and fashion items. Because of their popularity, platform companies have a (relatively) easy time finding and removing them. It’s a game of whack-a-mole, but algorithms tend to be good assistants to human fraud-prevention experts. That’s why the chart seems skewed near the center – there are sales in that section (especially on less-regulated platforms such as Alibaba), but less than you’d expect.
Now look further to the left. The tail is fat. In fact, it’s fatter than you’d expect it to be. That’s because fraud and counterfeiting are difficult to catch. The sellers tend to be smaller and have fewer resources to help bring counterfeits to the platform’s attention. Reactions tend to be slower, and they rely on customers to help catch them.
Case in point: #CopyPasteCris. This is a recent case of sophisticated plagiarism on the Amazon Kindle Store involving one “author” allegedly lifting portions of books from dozens of legitimate romance authors. It was not the authors nor the platform that caught the issue, it was a careful reader who uncovered the problem.
That’s not all. Where there’s smoke, there’s fire:
- Counterfeiting on Amazon
- The same problem rampant on eBay
- Poor-quality Google “zombie” search results
- Alibaba’s attempts to stop counterfeits in China (good luck)
- Facebook’s deepfake problem
- Extremism thriving on YouTube
- Even the founder of 8chan thinks it should be shut down
Why don’t the platforms pay more attention? We’ll cover more about the root cause of that in the next section. But for now, it’s enough to know that platforms consider bad actions and bad actors as a part of the business model – costs to be minimized, but costs that never can be eliminated. There is a tricky balance: These platforms rely on independent entities (sellers, reviewers, video producers, etc.) to provide the bulk of their “content” – for free. If platforms needed to produce (aka pay for) all of their content; they could not exist in their current form.
Cracking down too hard on the bad actors also makes it more difficult for legitimate content providers, but not doing enough erodes trust in the platform itself. While we can sympathize with their challenge, it isn’t the risks in the center of the distribution (the obvious ones we can see) that are the major problem. Those occur with enough frequency that we simply need to watch for them. It’s the events in the fat tail that are the problem. Most simply not have happened yet because they are so infrequent. But as we know from the inevitability of the mathematics, those nasty unknowable surprises will happen, given enough time and a large enough sample set. And the platforms are only getting bigger.
For those who want to build their own platforms, the knowledge that risks are (a) hidden, (b) unknowable, and (c) inevitable is quite sobering. Despite that, many of those risks can be mitigated. The first step is awareness. Our visual thought experiment can help us identify categories of risk for our medical device connectivity platform.
Risks are easier to spot when you know where (and how) to look for them. The best way to spot risks in a platform strategy is by using a fat tail visualization.
Essentially, this is a scenario planning tool that uses a statistical distribution of events (or the thought model of one) to help illustrate the risk profile of its platform strategy. Traditional scenario planning processes can be quite valuable, but they struggle with the critical input question – how do you decide what scenarios to consider? (Expert facilitators can help overcome some of these problems, but cannot eliminate them, especially in fat tail situations.) Using this visual technique illuminates the possibility that fat tail (unknowable, unpredictable) risks can occur, even if you can’t see them. You can read more on scenario planning processes, or consider hiring an expert facilitator, but let’s use a simple series of three questions to begin the risk assessment process, helping us brainstorm for possible risks:
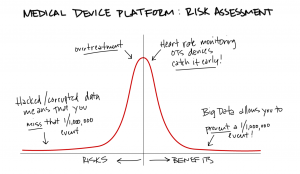
Question 1: How could a high-frequency positive outcome become a negative outcome?
This technique helps us mirror the “tall head” opportunities and discover risks. This is a good place to start because the risks here tend to be knowable and predictable – at the very least, they’re much more likely to happen given their relative frequency. In our medical platform example, collecting large amounts of data, without a clear hypothesis or study design, could lead to overtreatment. PSA screening for men and breast cancer screening for women tend to fall into this category.
Question 2: How could low-frequency positive outcomes become negative outcomes?
This technique helps us expose some fat tail risks by looking at the positive side of the fat tail for clues. For example, the medical device connectivity platform team may have written a case study on a thankful story from a user who – through the tracking of heart rate data – caught a hidden defect that would have been unexpectedly fatal. Question 2 asks us to mirror that unexpected event – what if the device on the platform missed a similar defect in someone else?
Question 3: What downside risks are we seeing in other (unrelated) platforms?
A “Black Swan” that occurs on another platform need not be “unexpected” for you. Question 3 asks us to look for nasty surprises happening on other platforms. For example, could a version of #CopyPasteCris (plagiarism on the Amazon Kindle Store) happen to our medical device platform? Could bad actors looking to commit insurance fraud manipulate data to lower their rates? It’s possible.
Before we move on, let’s be crystal clear: You cannot predict all risks in a fat tail. However, that does not mean you shouldn’t try; there is value in the effort. With even limited information and only a subset of all possible risks, you can make better decisions and put preventative measures in place.
Stop believing your platform is immune to risks. Start planning for the day when artificial protections are removed.
Doesn’t it seem odd that a fancy library is one of the world’s most valuable companies? That’s not to say that Google isn’t good at what it does, and not to say that information isn’t the arguably the world’s most valuable currency, and not to say that Google doesn’t offer any other value, but is organizing information really that valuable?
There seems to be little downside in the business model. If Google search links to incorrect, fraudulent, or offensive content, you can’t sue Google. Same with Gmail when it goes down. Same with Google Maps if it guides you to the wrong place. They’re all free. (Even the paid versions limit liability.) Yes, advertisers (who pay Google’s bills) might throw a fit over racist content on YouTube, but what other options do they have? Platform companies have matured to the point where they’ve eliminated all of their meaningful competition in a winner-take-all positive feedback loop.
Heads, Google wins. Tails, you lose.
Most people have come to accept the platform mantra of caveat emptor without much thought. They do not stop to realize that the only reason they can (largely) pay lip service to the fat tail problems in their business model is that our laws allow them to do that.
More specifically, the legal and regulatory framework in many countries shields platform companies from liability. In the United States, Section 230 of the Communications Decency Act of 1996 protects Internet Service Providers from liability for people who commit all manner of crimes using their network. We have allowed that protection to extend to Amazon, Facebook, and Google – and basically every other open platform. In other words, those companies can effectively transfer fat tail risks (which would be significant costs to other business models) to their users and advertisers.
In fact, platforms have a disincentive to do too much.
That same law that shields intermediaries (ISPs/libraries/platforms) does not shield them if they become involved in the content itself. You may remember the story of Backpage.com, a website that often-featured advertisements for prostitution. The platform was shielded, but when the court found evidence that the company was more actively involved, the shield vanished. But it’s not just about obvious issues such as prostitution; platforms that edit content for language can run into trouble – technically, they are no longer libraries; now they are newspapers – and hence subject to libel laws.
But all that is likely to change.
The same politicians who helped put those protections in place are now seeing the need to remove them. In the United States, Senators are different ideologically as Ted Crux (R-Texas) and Elizabeth Warren (D-Massachusetts) are both pushing for major overhauls to Section 230 legislation. Just last week, President Trump’s team leaked that it was working on an executive order to do just that.
Platform companies seem to have forgotten that they operate under a set of laws – laws that can change. Laws that are changing. Most entrepreneurs and investors excited about platform strategies aren’t paying attention to politics. They should.
What can an aspiring platform company – in this case, a medical device connectivity platform – do to plan ahead for the day when these laws may change? It’s useful to abstract the problem. Platforms are simply conduits for data – product sales, videos, social media posts, rental listings – they are all data of one type or another as far as the platform is concerned. In that case, we can use data management practices to help understand what precisely might be targeted by new legislation.
- Data collection: Our medical device connectivity platform gathers data from devices over a cloud infrastructure. In simpler terms, your customer’s pacemaker connects to her home’s Wi-Fi network and send that data to the platform’s central server. Mitigating risks from new laws could involve restricting collection only to those devices that meet certain security criteria. That would help prevent bad actors from flooding your servers with low-quality or potentially malicious data.
- Data processing: This is a key risk area for platforms – if they process data, they can be held liable for the results of that processing (see previous note on the difference between a “library” and a “newspaper”). Our medical platform could mitigate this risk by asking for explicit consent for any data processing rather than relying on implied consent. For example, the platform would ask the user to approve the process of analyzing heart rate data and sending it to your doctor.
- Data storage: Any time an asset resides somewhere, you need to secure it. That’s why there are locks on car doors and security guards next to bank vaults. The laws surrounding liability for data breaches are tricky. Mitigation strategies include the “nuclear option” (not storing data at all for any longer than absolutely necessary) to the “bulkhead strategy” (splitting up key parts of the data into different databases with non-connected redundancies).
- Data access: To grow quickly (“scale” in Silicon Valley’s language) most platforms try to remain as open as possible. The rationale is that restrictions on access impedes adoption by making it more difficult to use the platform. By now, you should see the inherent risk in that thought process – it is only valid because of a transient legal framework. HIPAA provides a better framework for data access, and it would be natural fit for our medical platform company example. However, this is one case where other platforms would be wise to follow those rules versus Facebook’s rules.
It bears repeating again: There is no way to predict all risks in advance, especially in a fat tail scenario. However, building a system that better balances “openness” with “security” will help prepare your platform for inevitable (and soon arriving) changes in legislation that will change your operating environment.
Stop trying to capture the entire market. Start strengthening your position with a barbell strategy.
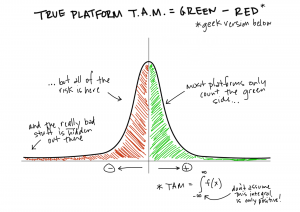
Let’s return to the mathematics for our risk mitigation strategy. What makes a platform so appealing is its ability to scale. By aggregating a few large chunks of demand, and many smaller ones, a single platform can dominate an entire market category. If we convert marketing language into mathematics, the total available market (TAM) is defined by the integral of the curve – the area underneath it.
This is the classic way to represent a platform TAM. After reading this far, we now know better. We need to look at the full picture. When we draw the full curve, the TAM is what’s left over when you subtract the bad side (left integral) from the good side (right integral).
Simply understanding that you need to subtract the negative market from the positive market in your valuation of your platform strategy is a revelation in itself, but that doesn’t tell you much about what to do to maximize your profitability while mitigating as many risks as possible.
Let’s visualize how we might do that.
Instead of trying to capture the entire market, we’re slicing off part of the “head” and a part of the “tail,” sacrificing large portions of the fat tail as well as the “middle market” to other platforms. While it may seem against some Silicon Valley religious text to say “no” to any part of the potential market for a platform, this approach better focuses our attention in three ways:
- Capturing all of the demand forces us to think about the platform more than we think about the content on the platform. In other words, traditional platform strategies concentrate more on their technology (and how cool it is) rather than their users and use cases.
- Focusing on the tall head ensures we can capture those few uses cases that generate disproportionate revenues. It also makes sure we stay focused on those needs.
- Focusing on a complementary portion of the fat tail ensures we don’t miss those ancillary use cases that support the tall head. Instead of the entire fat tail, we’re cherry picking those use cases that relate to our top customers’ needs.
The idea here is to employ a use case-centered platform strategy versus a market-centered platform strategy. As we’ve seen, we are exposed to risks in a platform strategy from both known, unknown, and unknowable events. The more we understand the use cases and customers, the more we can understand (and then mitigate) a much larger portion of the risk profile.
In finance, they call this a “barbell” strategy because that’s what it looks like. Your portfolio consists of only ultra-low risk assets and hedges on one side, and ultra-high risk and high-return investments on the other, with nothing in between. There’s plenty of math to show why this works, but I like the simpler reason: Because you only are concerned with extremes, you pay better attention. Focusing on everything in the “muddy middle” or the “total market” mean you can’t pay attention to everything. You’ll miss stuff. It’s inevitable.
Our medical device connectivity platform example makes the illustration of the strategy clearer.
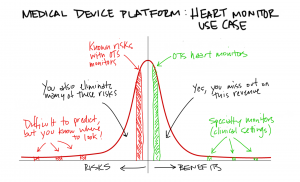
By focusing on the “hospital to home” heart monitoring use case, we select only those devices that fit the “tall head” and their related devices in the “fat tail.” We eliminate the muddy middle (and most of the tail) entirely. This strategy need not preclude growth. Our platform could scale by expanding the set of devices and data collection those people use (perhaps common exercise equipment and Apple Watches on one side, and physical therapy specialty equipment on the other). In other words, instead of trying to collect “all” health device data on one platform, mitigating the risks involves refocusing on the users and their needs.
Its platform technology can focus on specific types of data (heart rate and related health issues) instead of all types of health data. This level of specialization reduces the risk of “lowest common denominator” protections and knowledge. The resulting barbell approach gives direction to which areas of the fat tail to look for opportunities. While it cannot eliminate risk, by choosing the risks you take, you convert an unknown or unknowable risk into a knowable one. You can better mitigate a risk you understand.
Yes. This means you have to make choices. Mitigating fat tail risk with a barbell strategy means you must cede portions of your total market. It’s no longer an open platform that does everything for everybody.
You’re also far less likely to get hit by a metaphorical bus you didn’t see coming around the corner.
That seems like a fair trade.
Conclusion
Platform strategies aggregate consumer demand in a way no other business model can match. They provide countless opportunities for small businesses to exploit niche opportunities that would be too small for large companies to pay attention to, therefore satisfying a wider range of needs and wants. The ability to make money enabling thousands (or billions) of transactions is the pied piper of Silicon Valley. However, those entrepreneurs and investors are underestimating the inherent risk in large data sets in four specific ways:
- They mistake a “fat tail” for a “long tail.” This simple error obscures the risk of major negative events. Formal scenario planning can help mitigate the knowable risks, but it can do nothing to address unknowable risks (aka Black Swans).
- They misinterpret emerging threats as costs of doing business – counterfeiting, fraud, and other crimes transfer the risk from the platform to the entrepreneur and the consumer, ultimately providing limited incentives for the platform provider to act to correct them.
- They believe legal and regulatory frameworks are unchanging features of the market landscape. They forget that critical aspects of the law protect them, artificially, from liability. Those laws can be changed at any time.
- They succumb to greed of capturing the entire market. A barbell strategy (taking the highest volume on one end and the most complex and niche at the other, while ignoring the middle ground) helps hedge against fat tail risks.
We’re enamored with platforms the same way we were enamored with the housing market in 2007. There is nowhere to go but up! The reason we’re still excited about platforms is that we haven’t seen one of them implode. Fifty years ago, no one thought the original “platform” company (Sears) would implode. And yet, here we are. It may seem unthinkable that Facebook, Amazon, or Google will collapse. It’s not. It is only a matter of time.
You should be careful using their strategy as a role model for yours.